AWS revenue growth re-accelerated to 39% while its operating margin held near 39%

Line and marker chart of AWS quarterly year-over-year revenue growth and operating margin in percent from the quarter ending 2021-03-31 to 2026-09-30. Growth falls from about 39.5% in late 2021 to 12.2% in mid-2023, then climbs back to 39.3% in the September 2026 quarter, while operating margin rises from about 24% in 2023 to 38.7%.

AWS revenue grew 39.3% year over year in the quarter to September 30, 2026, its fastest since the 39.5% of the fourth quarter of 2021 and more than triple its 12.2% low in mid-2023, while its operating margin was 38.7%, up from 24.0% in early 2023, according to Amazon’s SEC filings. That means the re-acceleration behind SI News’s report on AWS’s AI demand has come without the profit squeeze that accompanied the 2022 to 2023 slowdown, even as Amazon’s capital spending surged. An earlier SI Plots post drawn from the same filings also shows growth accelerating, but it puts fourth-quarter 2025 growth at 18.2%, whereas Amazon’s reported segment sales give 23.6% (24% in Amazon’s own release).

Sources & Notes

• 0 Comments

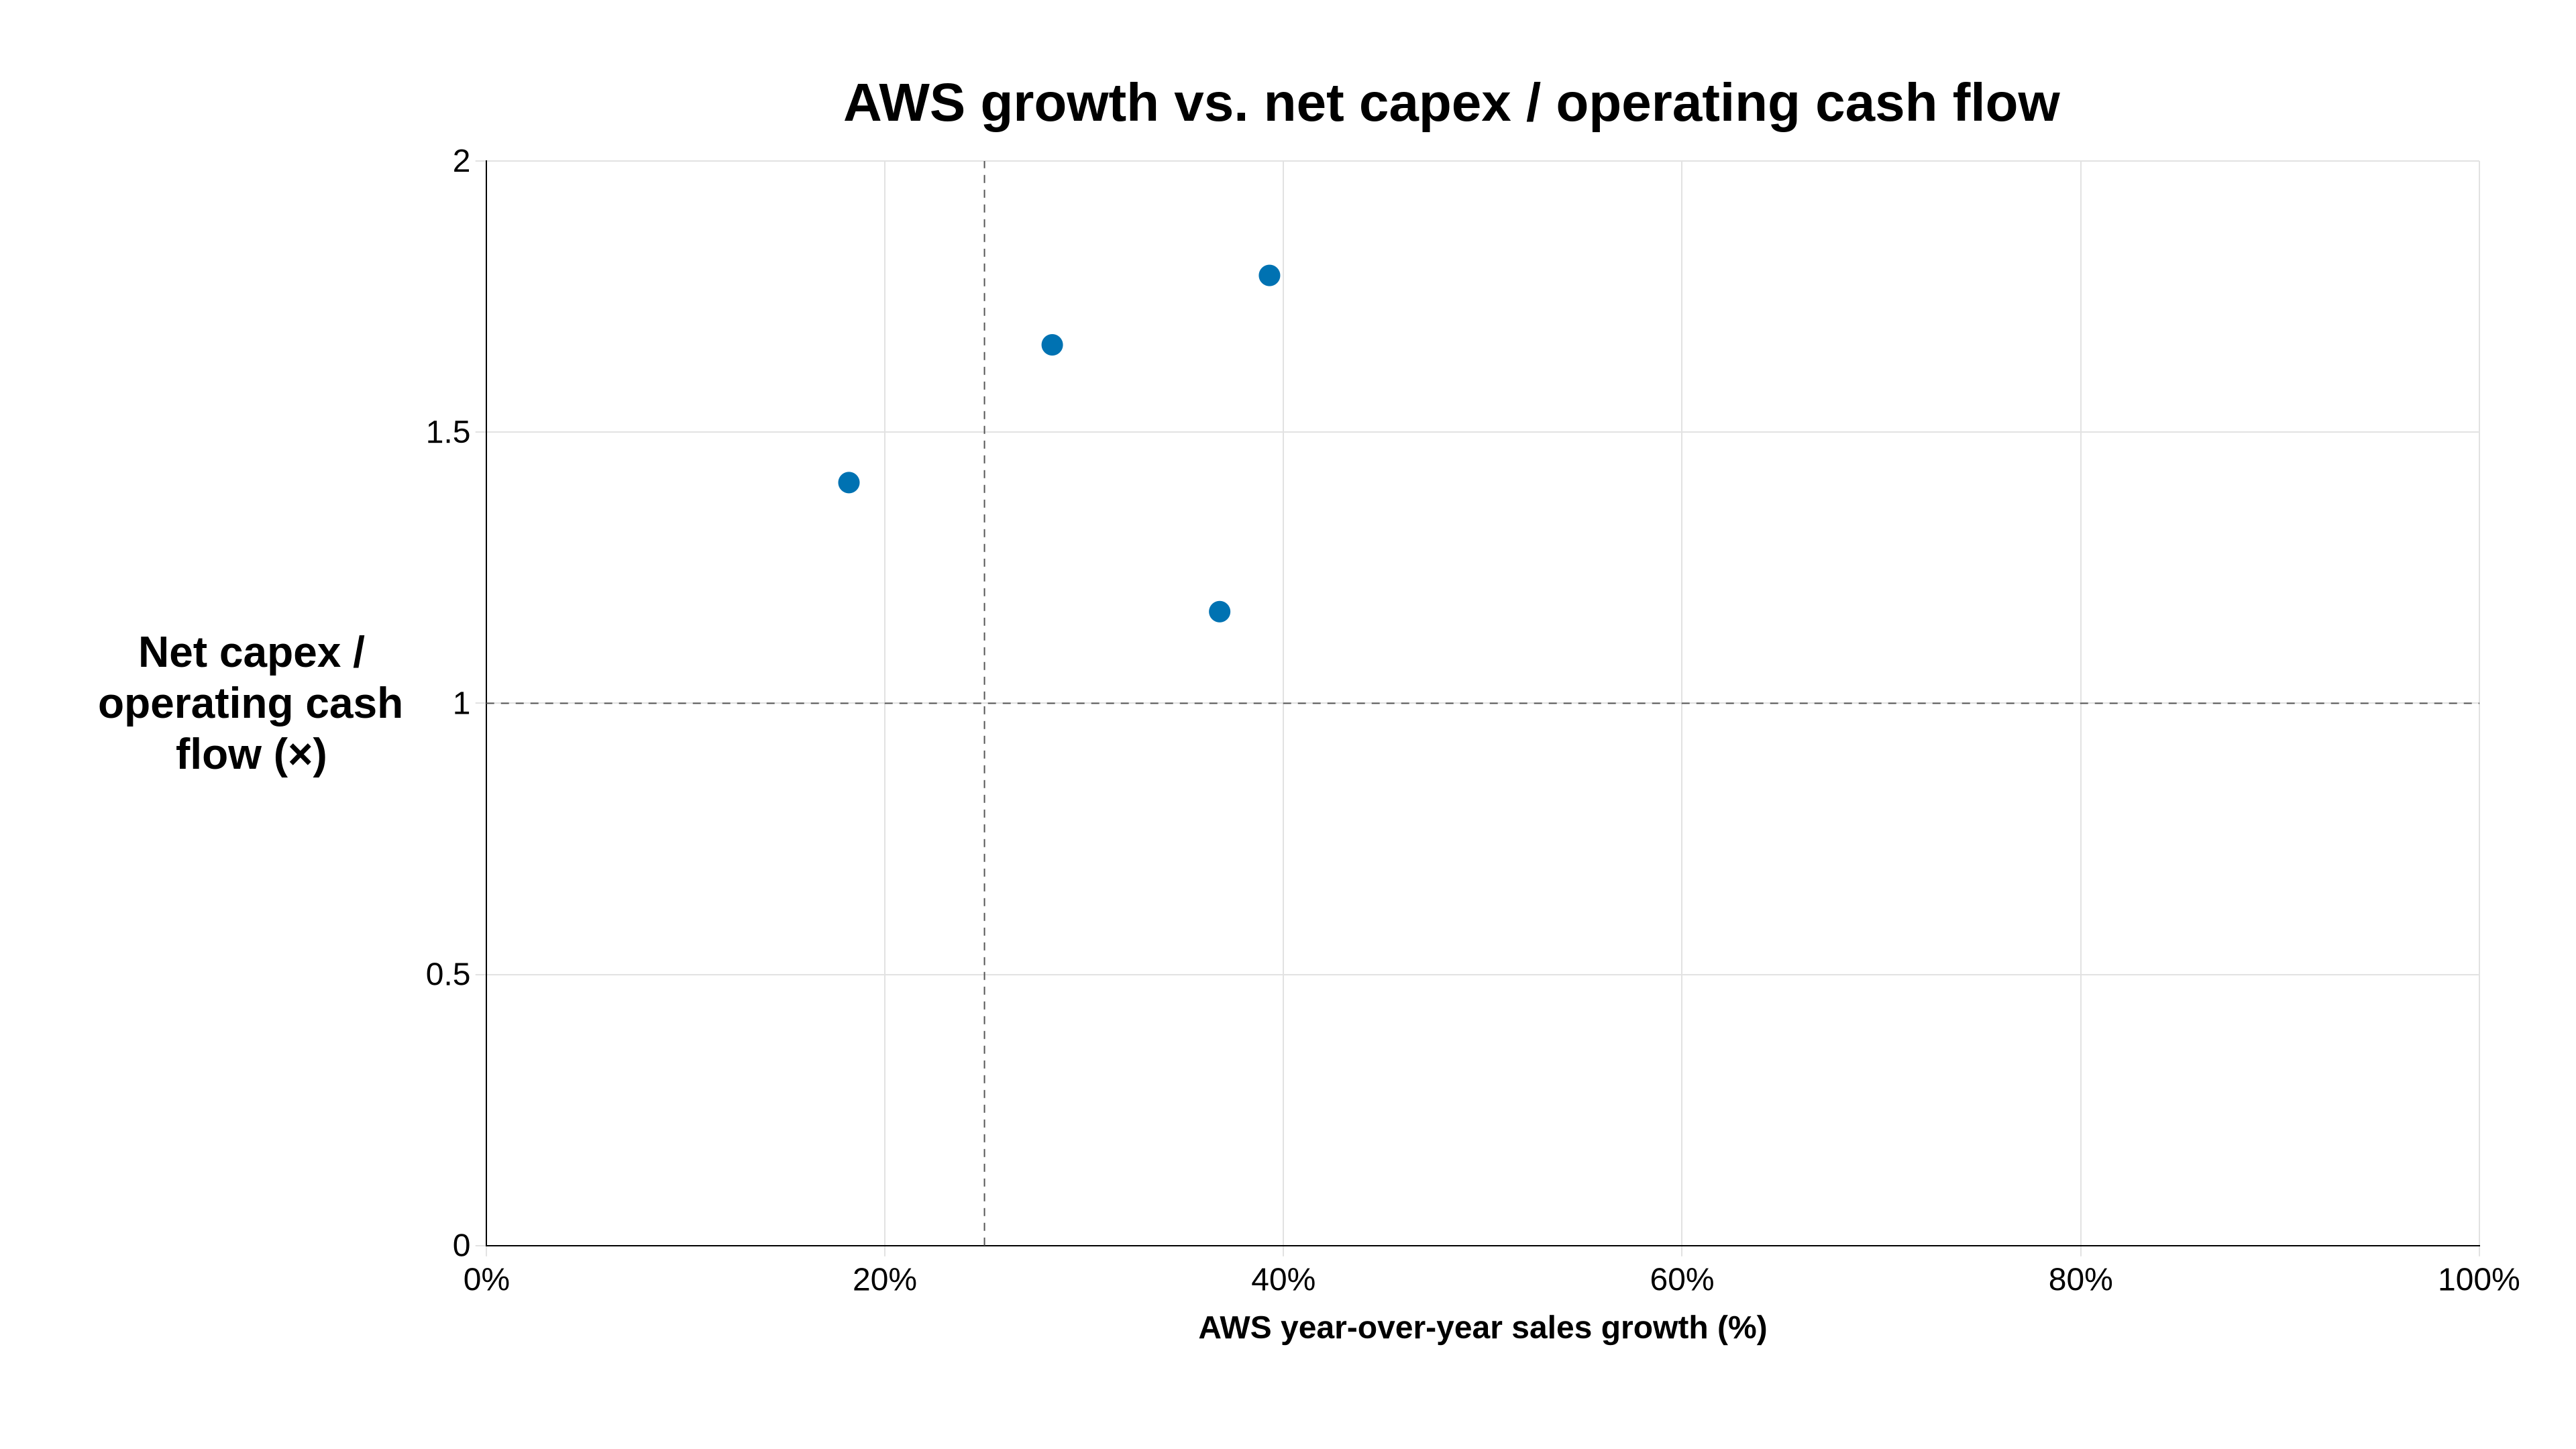
AWS growth accelerated as Amazon’s net capex reached 179% of operating cash

AWS growth vs. net capex / operating cash flow

AWS year-over-year growth accelerated from 18.2% in Q4 2025 to 39.3% in Q3 2026, while Amazon’s quarterly net property-and-equipment spending rose to 179% of operating cash flow. The ratio exceeded 100% in all four quarters, meaning reported operating cash did not cover net capex during this AI-led expansion. The independent SEC filings quantify the spending pressure behind SI News’s report of AWS demand-driven growth and record quarterly capital investment.

Original SI News story: Mistral Opens Large 4 Open Weights | Canada Takes Stake in Cohere’s Record Round | AWS Growth Hits 39% on AI Demand

Data sources

Categories: AI

• 1 Comment

Microsoft is the only one of four big AI spenders with positive free cash flow in the September quarter

Line and marker chart of quarterly free cash flow in USD billions for Amazon, Alphabet, Microsoft and Meta from the quarter ending 2024-03-31 to 2026-09-30. In the latest quarter Microsoft is at about 18.6 billion while Meta is at minus 1.2, Alphabet at minus 9.1 and Amazon at minus 34.8 billion, below the dashed zero line.

In the quarter to September 30, 2026, Microsoft generated $18.6 billion of free cash flow ($58.0 billion of operating cash flow minus $39.4 billion of cash capex), while Amazon (minus $34.8 billion after $77.3 billion of capex), Alphabet (minus $9.1 billion) and Meta (minus $1.2 billion) each spent more on property and equipment than their operations brought in. That gap is the backdrop to the Azure-led earnings beat SI News reported, and the new September-quarter filings point the same way as earlier SI Plots charts of Meta’s capex overtaking its cash generation and Amazon’s trailing-year capex exceeding operating cash flow, this time measured as quarterly dollars of free cash flow for all four companies.

Sources & Notes

• 0 Comments

Azure growth accelerated faster than Microsoft Cloud growth

Azure growth accelerated faster than Microsoft Cloud growth

Across Microsoft’s five latest reported quarters, Azure and other cloud-services growth accelerated from 39% to 48%, while Microsoft Cloud growth rose from 26% to 30%. The widening gap matters because the Azure result in SI News’s earnings story is part of a sustained acceleration in Microsoft’s infrastructure business, not just a one-quarter headline.

Original SI News story: Google Unveils Gemini 4 Carbon Frontier Model | Microsoft Azure Jumps 48% in Earnings Beat | New York Restricts AI Companions for Minors

Data sources

Categories: AI

• 0 Comments

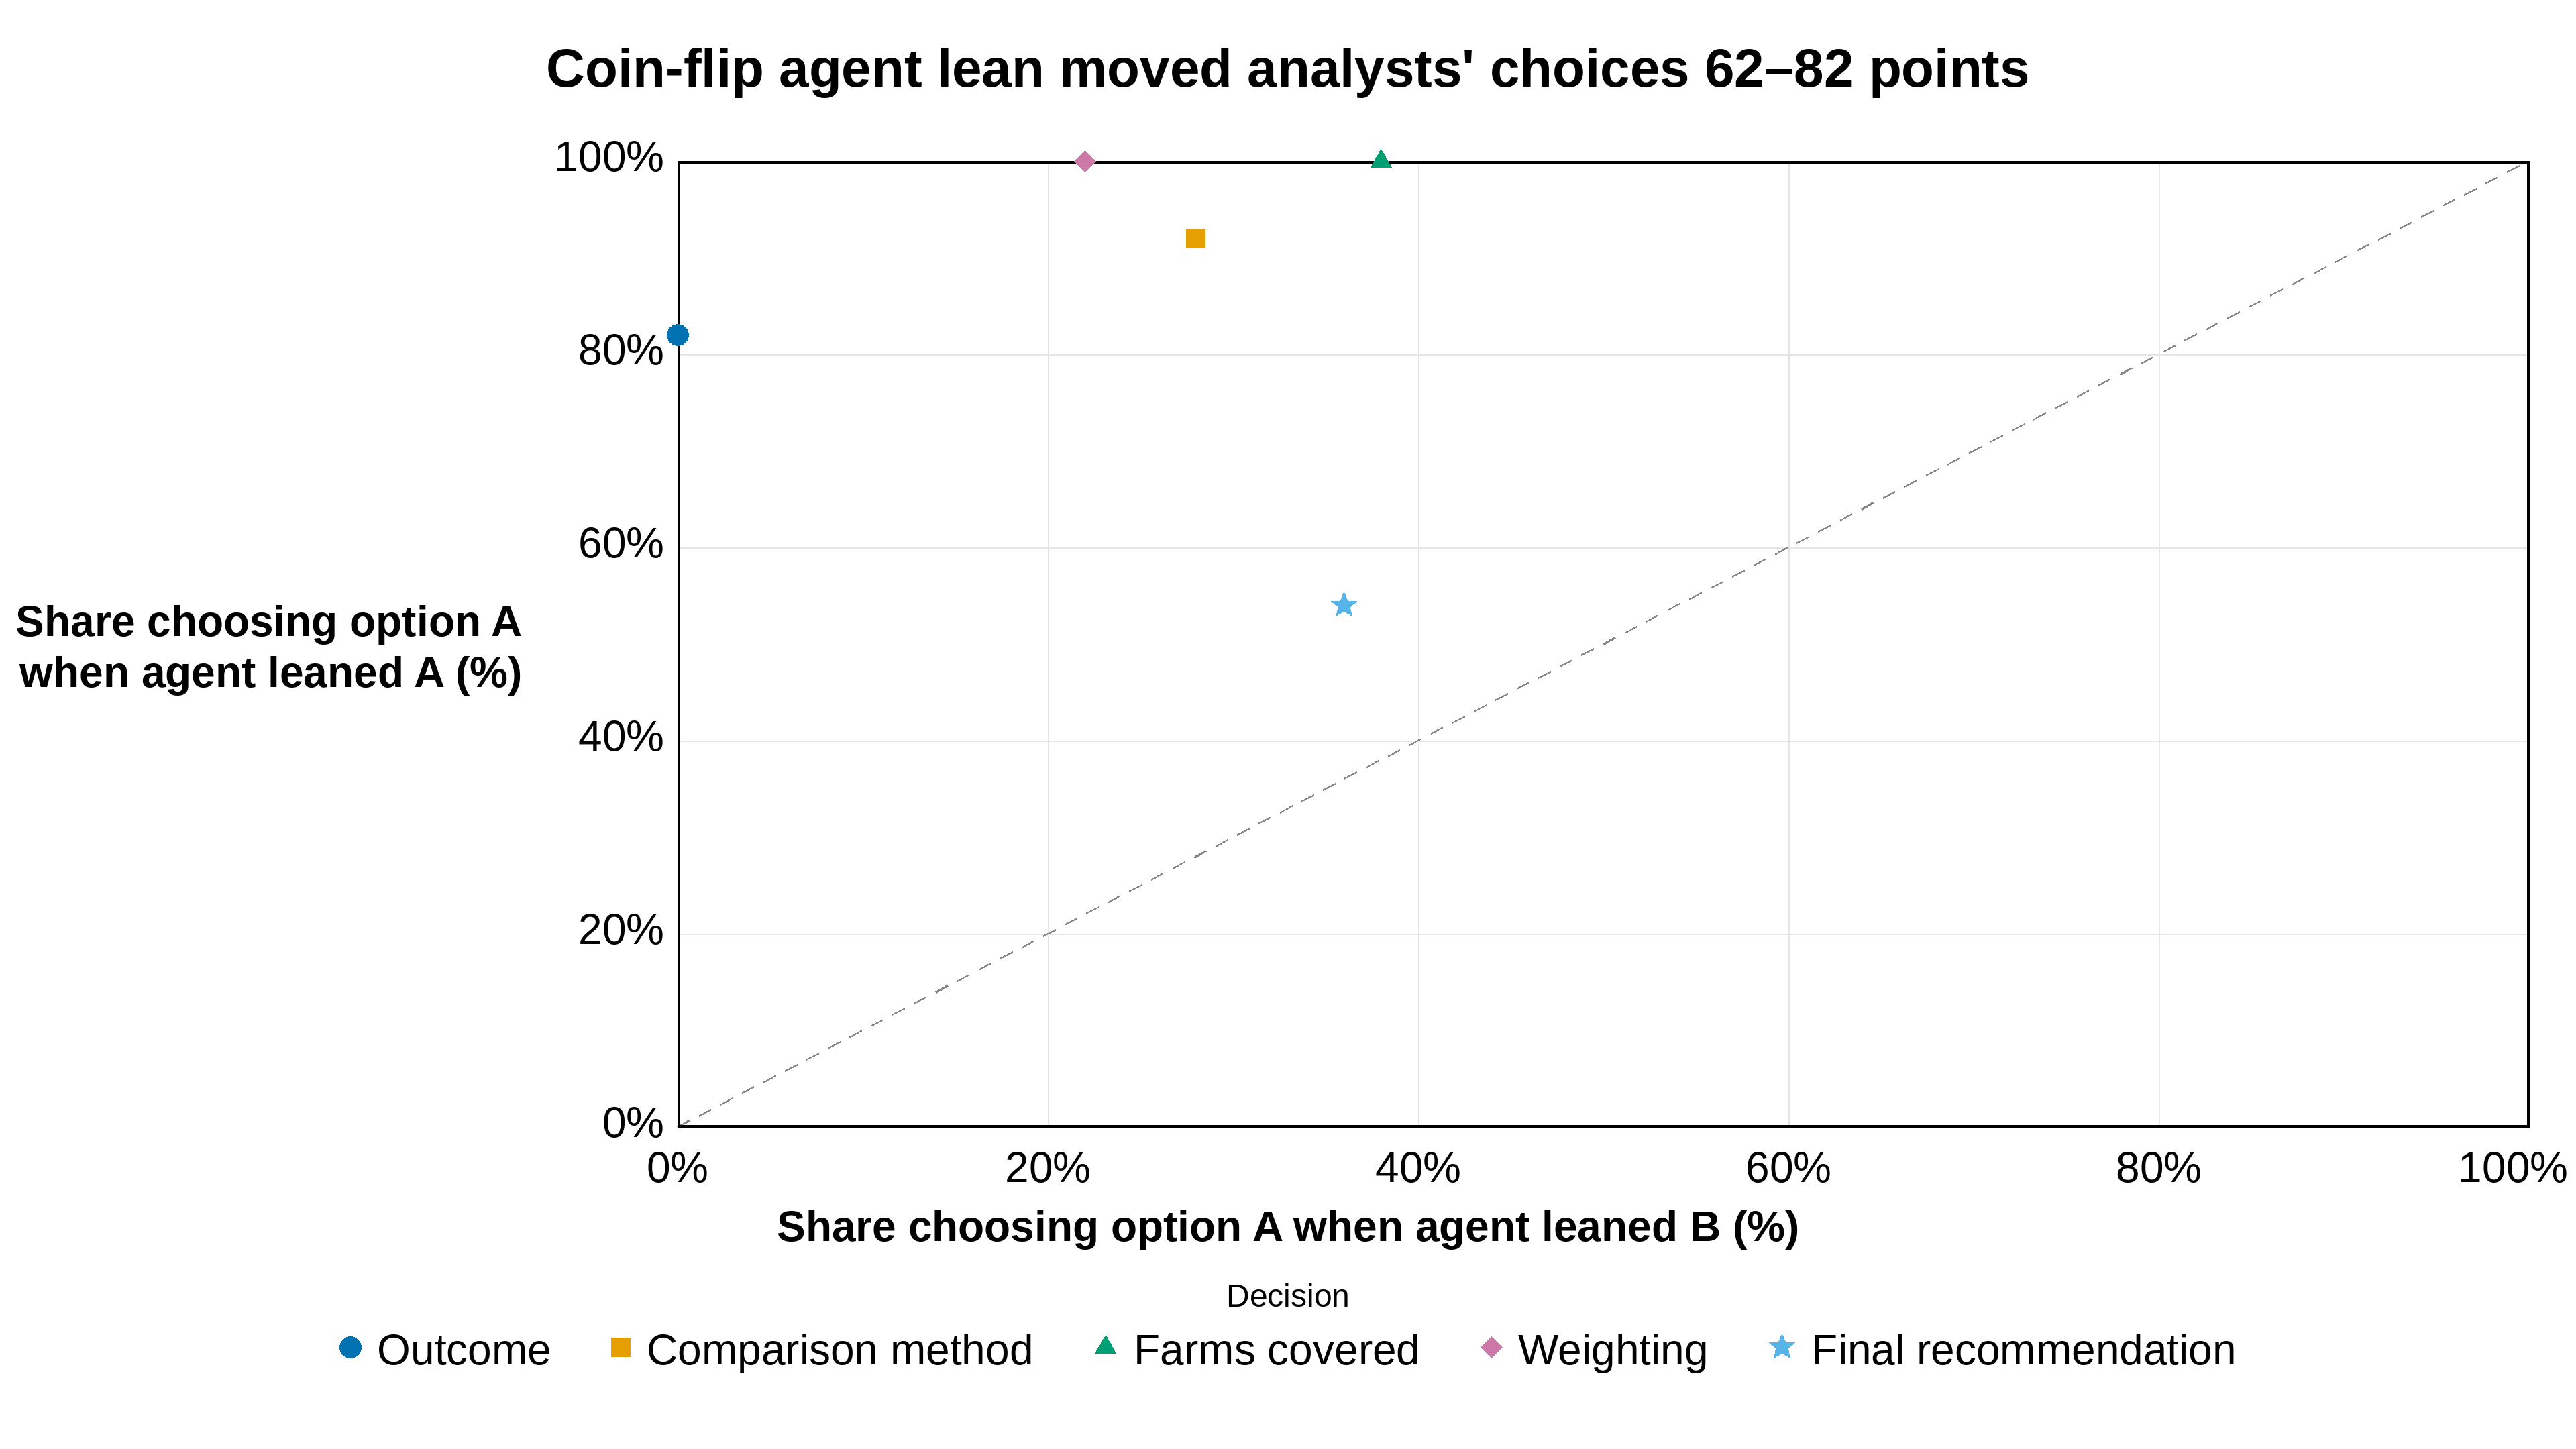
Coin-flip agent lean moved analysts’ choices 62–82 points

Coin-flip agent lean moved analysts' choices 62–82 points

In Anthropic’s randomized trial, 50 professional analysts using Claude Code followed the option their agent had been secretly assigned by coin flip: on each of four analytical decisions, the share choosing option A was 62 to 82 percentage points higher when the agent leaned A than when it leaned B, while the final recommendation moved only 17 points (54% versus 36%). The gap matters because a human sign-off is supposed to be an independent check on AI-assisted work — yet analysts’ choices largely tracked a randomly assigned preference, and 77% later repeated the agent’s arguments while only 15% credited it. The finding comes from the analyst-deference study in the October 28 SI News roundup.

Sources & Notes

  • Original story: Google DeepMind unveils Genie 4 world simulator | Anthropic finds analysts defer to AI agents | Malaysia seizes $12 million in AI chips
  • Data sources: Herdağdelen, Joren, & Tamkin (2026). How AI agents shape experts’ judgment calls
  • Notes: Shares are Figure 2 values from the Anthropic study: the share choosing option A when the agent leaned B versus leaned A, for 50 analysts (11 of 61 recruits were excluded because they chose not to use the agent). The agent’s lean was set by coin flip and deliberately strengthened so its effect could be measured; the study covers one task, one field, and one model (Claude Opus 4.8). The dashed diagonal marks the no-influence line where the lean would make no difference; the final recommendation counts a one-year extension as not rolling out the program. Legend labels shorten the five decisions: outcome measure, comparison method, farms covered, weighting, and final recommendation.

Categories: AI

• 0 Comments

Analysts followed an AI agent’s lean 81%–92% across four decisions

Analysts followed an AI agent’s lean across four analytical choices

In Anthropic’s randomized study, professional analysts matched their agent’s deliberately assigned preference in 92% of outcome-measure choices, 82% of comparison-method choices, 81% of coverage choices, and 90% of weighting choices. The consistency shows that AI influence reached the analytical choices experts were expected to own, quantifying the judgment-deference finding in SI News’s report.

Original SI News story: Google DeepMind unveils Genie 4 world simulator | Anthropic finds analysts defer to AI agents | Malaysia seizes $12 million in AI chips

Data sources

Categories: AI

• 0 Comments

Meta’s buybacks fell to zero in 2026 as nine-month capex reached $83 billion

Line chart of Meta's January-September capital expenditures and share repurchases in USD billions, 2017 to 2026. Capex rises from 4.5 in 2017 to 22.8 in 2024, 48.3 in 2025 and 83.1 in 2026; repurchases peak at 30.1 in 2024, are 26.2 in 2025 and fall to zero in 2026.

Meta spent nothing on share repurchases in the first nine months of 2026, down from $26.2 billion in the same period of 2025 and $30.1 billion in 2024, while its purchases of property and equipment rose to $83.1 billion from $48.3 billion a year earlier. Having halted buybacks and added $24.9 billion of new long-term debt this year, Meta is now turning to equity, as SI News reports it plans to raise up to $95 billion in stock for AI infrastructure. The capex trend is consistent with the earlier SI Plots chart showing Meta’s capex overtaking its free cash flow, but both draw on Meta’s own reported figures, so this chart adds the buyback reversal rather than independent confirmation.

Sources & Notes

• 0 Comments

Grok and GPT pick opposite parties — until search is off

Grok and GPT pick opposite parties — until search is off

With web search on, GPT-6.1 Sol named the Democrat in 97.4% of its major-party answers while Grok 4.7 named the Republican in 91.7%, the mirror image Convovo found across the 2026 midterm races. Turning search off left GPT’s lean almost unchanged at 96.0% Democrat, but Grok’s lean disappeared: it declined to pick in 27 of 30 sample races, and its only three picks named the Democrat. The result, from a forced-choice API prompt that the consumer apps themselves declined, suggests GPT’s lean is baked in while Grok’s depends on what it searches — a distinction that matters for anyone building voter tools on these APIs.

Sources & Notes

  • Original story: Grok and GPT Split on Midterm Picks | Apollo Finds No AI Payoff Outside Tech
  • Data sources: Convovo (2026). AI Ballot 2026; TechCrunch (2026). Forced to pick, Grok’s AI model chooses Republicans. OpenAI’s picks Democrats.
  • Notes: Shares are of answers naming a Democrat or Republican candidate. The search-off sample covered 30 races: GPT named the Democrat 24 times, the Republican once, and declined 5 times; Grok declined 27 times and named the Democrat 3 times, so its search-off point rests on only 3 picks. The main test used a forced-choice prompt through the models’ APIs with web search on; the consumer ChatGPT and Grok apps declined to answer. The two models agreed in under 10% of races. For context, GPT still picked the Democrat in 57 of 67 heavily Republican districts and Grok still picked the Republican in 47 of 72 deep-blue districts.

Categories: AI

• 0 Comments

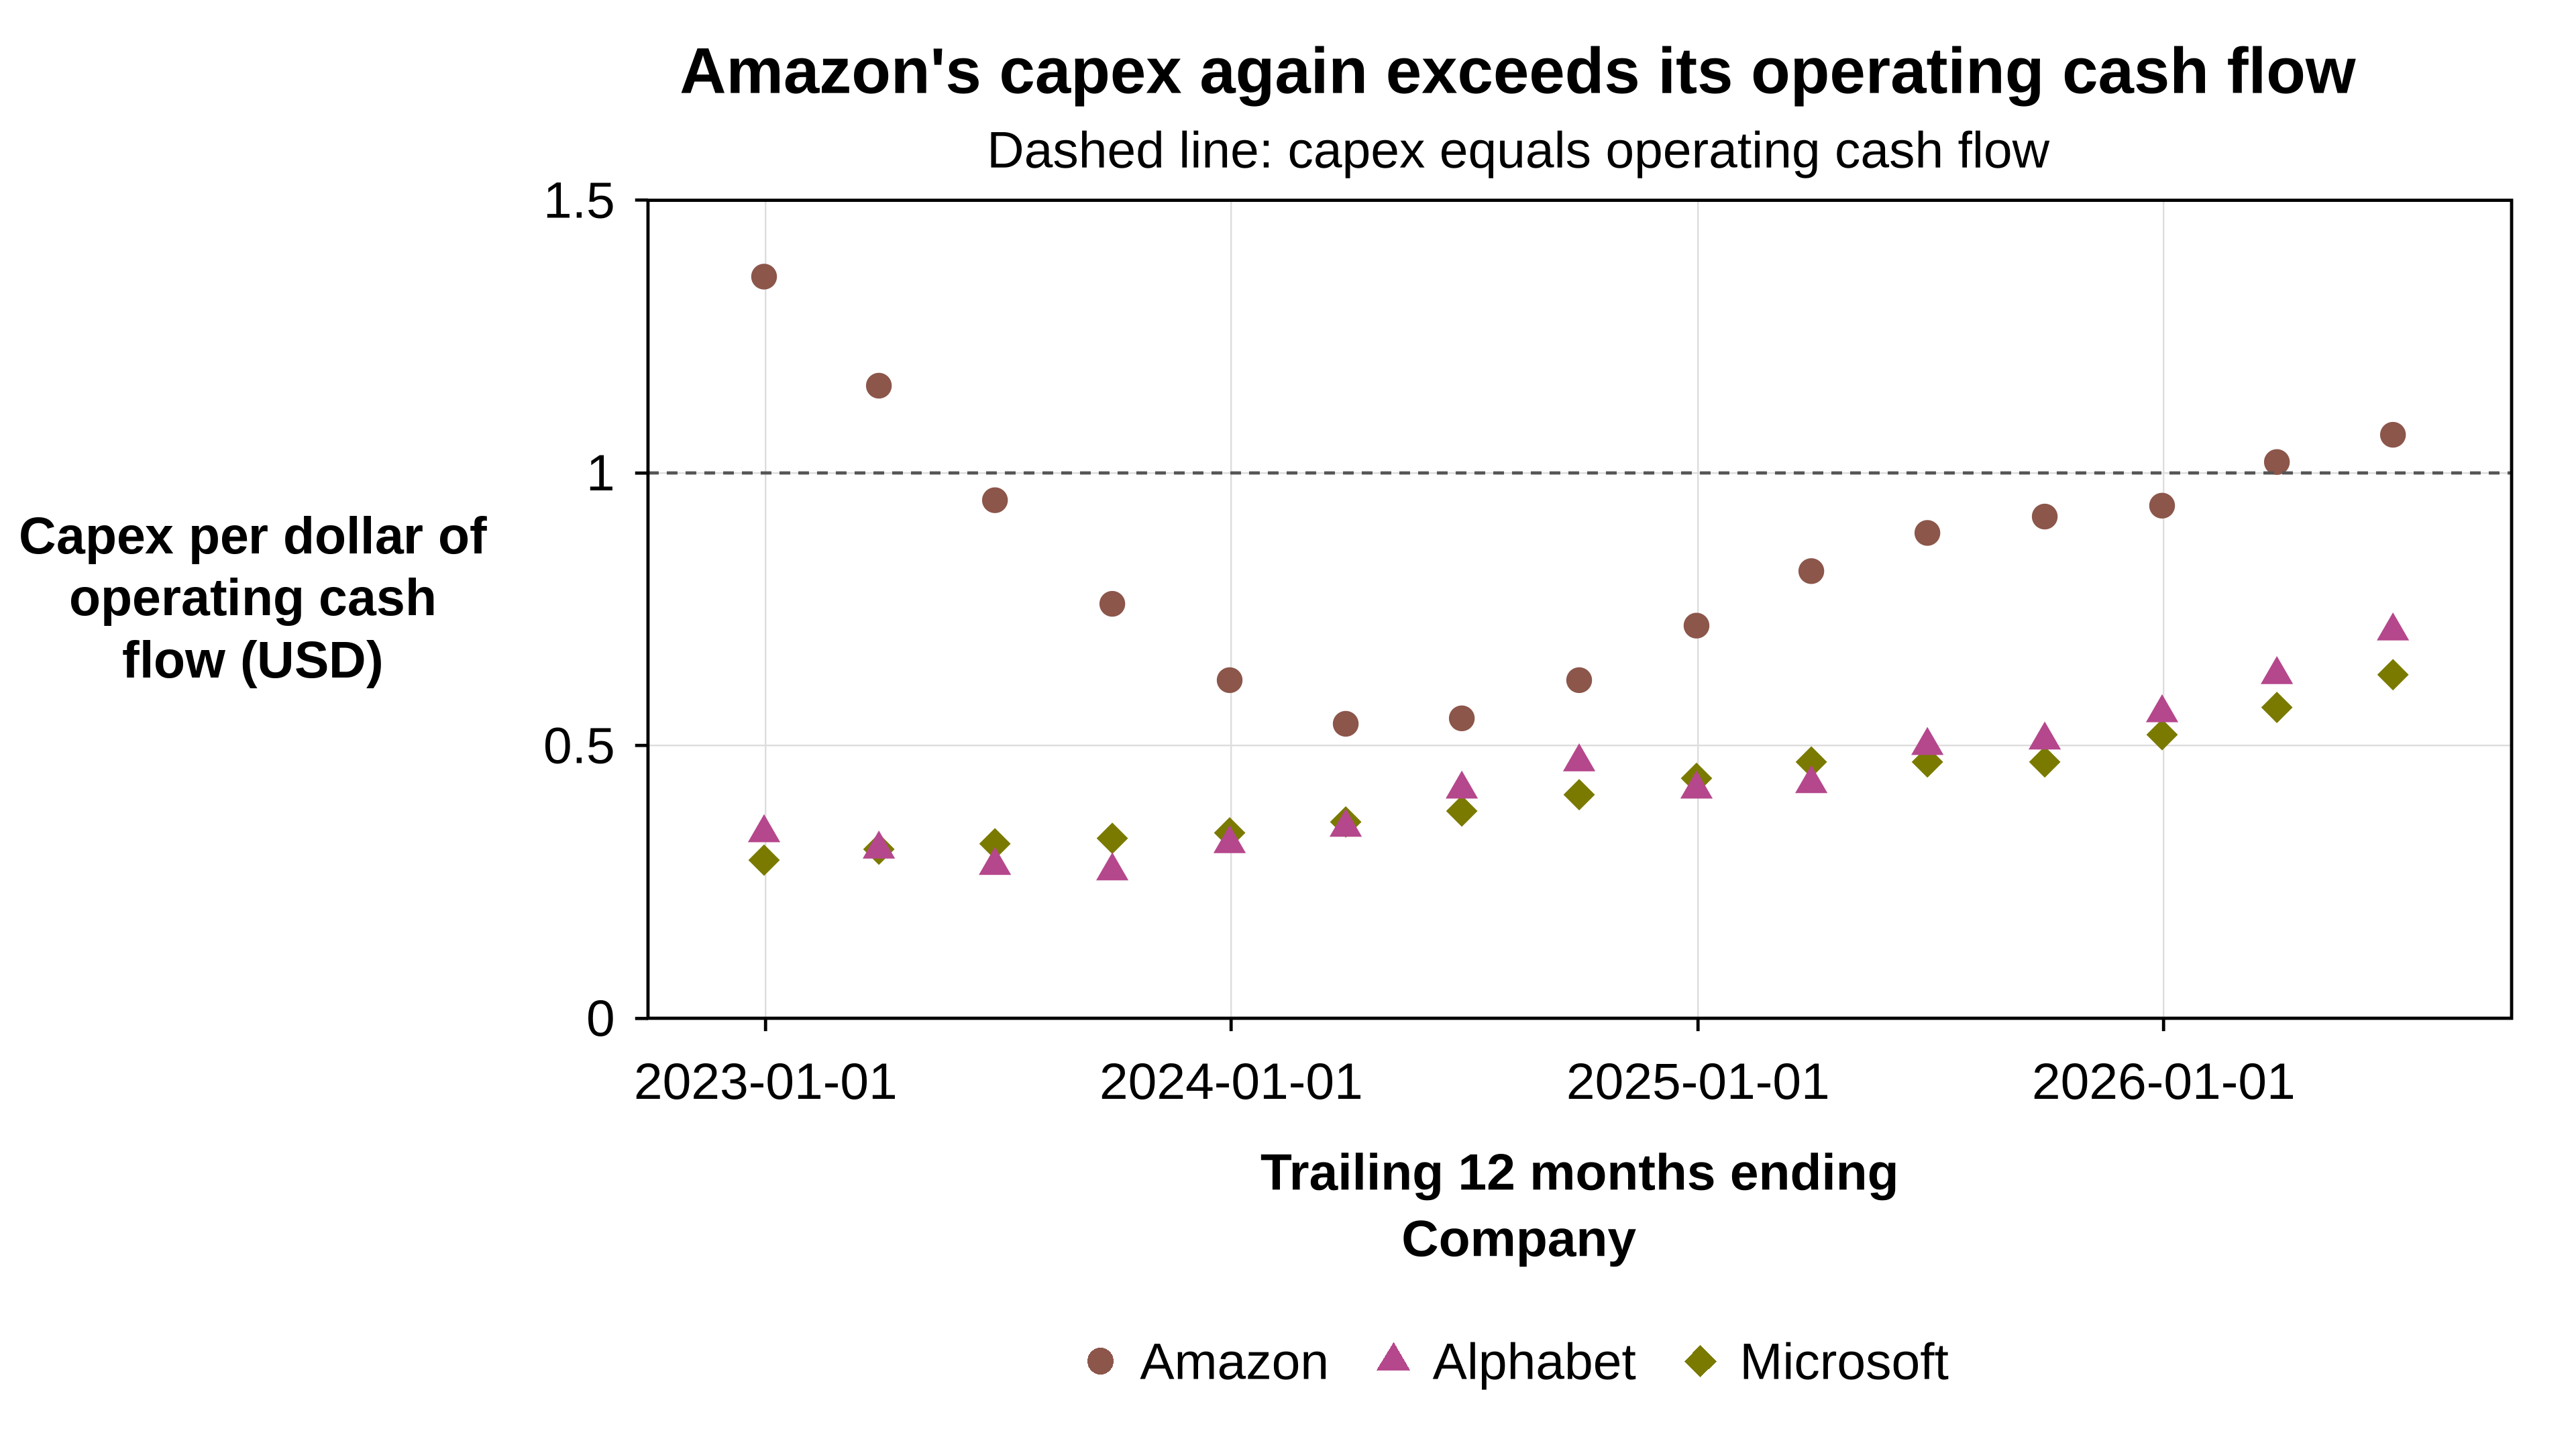
Amazon’s capex again exceeds its operating cash flow as Alphabet and Microsoft climb

Scatter chart of trailing-12-month capital expenditures per dollar of operating cash flow for Amazon, Alphabet and Microsoft, quarterly from 2022-12-31 to 2026-06-30. Amazon falls from 1.36 to 0.54 by early 2024, then rises to 1.07, above the dashed 1.0 line; Alphabet rises from about 0.3 to 0.71 and Microsoft from about 0.3 to 0.63.

In the 12 months to June 30, 2026, Amazon spent $1.07 on property and equipment for every dollar of operating cash flow ($173.0 billion against $161.4 billion), up from $0.54 in the year to March 2024 and back above 1.0 for the first time since the year to March 2023, while Alphabet rose to $0.71 and Microsoft to $0.63 from roughly $0.30 in early 2023. That leaves Amazon funding part of its buildout from outside operating cash even as its CEO says, per SI News, that AWS capacity is sold out for 2026 and largely for 2027. These filings for three other companies point the same way as the earlier SI Plots chart showing Meta’s capex overtaking its cash generation, using trailing-year cash capex rather than Meta’s quarterly capex including finance leases.

Sources & Notes

• 0 Comments

GPT and Grok split by party across every 2026 race type

GPT and Grok show a party split across every race type

Convovo's complete 506-race dataset shows GPT-6.1 Sol chose Democratic candidates in 85.7%–91.7% of Senate, House, and governor races, while Grok 4.7 chose Republicans in 80.0%–86.1% of those same offices. The office-level consistency extends the SI News headline beyond its aggregate figures and shows that the model split was not concentrated in one kind of contest.

Original SI News story: Grok and GPT Split on Midterm Picks | Apollo Finds No AI Payoff Outside Tech

Data sources

Categories: AI

• 0 Comments